Family Homelessness in SF: By the Numbers
Last Updated: September 2026
Family homelessness cannot be measured by one number.
Unlike single adults, homeless families are often hidden from view. As a result, it can be hard to get an accurate picture of the crisis.
This dashboard brings together multiple sources of information to gain a more complete image of family homelessness in San Francisco. Each data set measures something slightly different, and each comes with its own blind spots. But together they offer a more complete understanding.
Homeless family members in the 2026
Point-in-Time Count
1,474
Family members on the SF shelter waitlist
670
Family members currently staying in a SF shelter
1,013
Family members assessed via Coordinated Entry in 2026
4,350
SFUSD homeless students in the 2025-26 school year
3,217
How do we define a homeless family?
Before we get into the numbers, we need to understand how various counts define family homelessness. The Department of Housing and Urban Development (HUD) definition is the strictest definition, only counting individuals and households staying in a place not meant for human habitation OR staying in a shelter. Other counts are more expansive and include doubled up families, and families who are couch-surfing.
We created a legend you can use to determine how each number defines family housing.


Includes Families
Couch-Surfing
Includes Couch-Surfing and
Families Doubled-Up

HUD Definition of Homelessness
STRICTEST
Four ways we understand family homelessness.
The Point-in-Time Count


Source: San Francisco Department of Homelessness and Supportive Housing, 2026 Point-in-Time Count: Preliminary Results, 2026.
What it measures
The federally required Point-in-Time (PIT) Count estimates the number of people experiencing homelessness during a single night in January. Conducted every two years, it provides the only standardized federal count published on a regular basis. The San Francisco Department of Homelessness and Supportive Housing began to partner with Compass and other homeless service providers a few years ago to reach families via phone, since a street count is more difficult with this population. This, in part, led to a more accurate count of unsheltered families starting in 2024.
Why it matters
The PIT Count is used for federal reporting, and determines allocation of resources for homelessness across city, county, and federal agencies. It also provides an opportunity to compare each bi-annual snapshot with more than two decades of trend data.
What it doesn’t capture
The PIT Count relies on visual observation, and families are more likely to stay out of sight. The most recent San Francisco PIT Count occurred in the morning, when many families has already left for work or school. It also undercounts those who are unsheltered but happened to have shelter for that one night.
San Francisco Shelter Waitlist
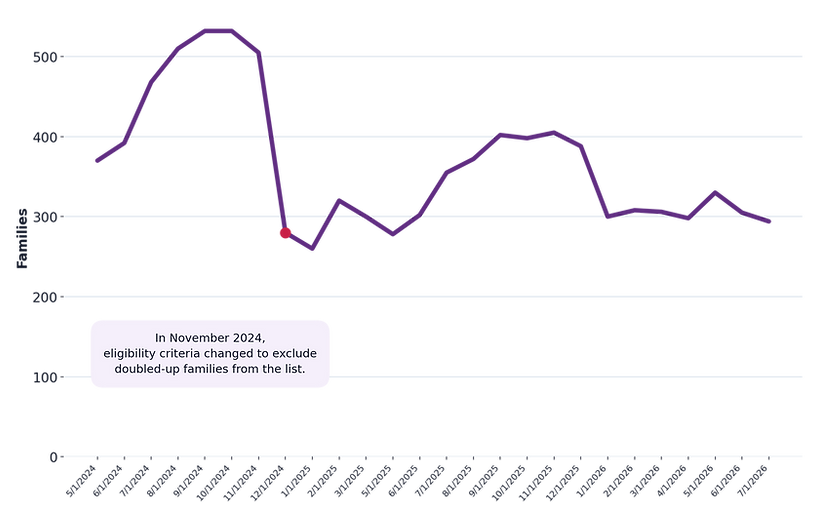
Source: San Francisco Department of Homelessness and Supportive Housing, Shelter and Crisis Interventions dashboard.
What it measures
The number of eligible families actively waiting for a family shelter placement because no space is currently available. It reflects demand for emergency shelter that exceeds available capacity.
Why it matters
The waitlist is one of the clearest indicators of unmet need, showing how many families are seeking shelter but cannot immediately access it. Changes in the size of the waitlist can help illustrate shifts in demands for shelter and highlight gaps between available shelter capacity and the number of families needing assistance. There are currently more families on the shelter waitlist than counted as unsheltered in the 2026 PIT count.
What it doesn’t capture
The shelter waitlist does not include every family experiencing homelessness. Only families who are assessed at an Access Point and meet eligibility requirements for family shelters are included, meaning many families who are doubled up or otherwise unstably housed are not represented. There are also several ways that families are "dropped" from the waitlist, including families who don't check in with Access Points at designated intervals or who decline congregate shelter, even if they remain homeless.
Coordinated Entry Assessments


Source: San Francisco Department of Homelessness and Supportive Housing. Online Navigation and Entry (ONE) System. Data accessed September 2026.
What it measures
Coordinated Entry Assessments track the number of families who complete San Francisco's standardized assessment process to access publicly funded homelessness resources. Because most families seeking housing assistance begin with this assessment, it provides insight into how many families are entering the homelessness response system.
Why it matters
Assessment data helps illustrate demand for shelter/housing resources and supportive services by measuring the number of families actively seeking assistance. It also provides a consistent way to understand changes in service demand over time and helps planners anticipate future resource needs.
What it doesn’t capture
Assessment data includes only families who complete the Coordinated Entry process. Families who never seek services or choose not to engage with the system are not represented. Because assessments can be lengthy and emotionally difficult, some families may face barriers to completing the process, meaning the data does not reflect every family in need.
San Francisco Unified School District Students


Sources: California Department of Education, DataQuest: Homeless Student Enrollment by Dwelling Type, and California School Dashboard: San Francisco Unified Summary.
What it measures
San Francisco Unified School District identifies students experiencing homelessness throughout the school year under the federal McKinney-Vento Act. This includes students who, at any point during the previous year, were living in shelters, hotels, vehicles, doubled-up housing situations, or other temporary living arrangements, providing a broader picture of housing instability among school-aged children.
Why it matters
Because schools interact with students throughout the year, they often identify children and families who never appear in traditional homeless counts or shelter systems. This data also provides valuable insight into the educational impacts of family homelessness and helps reveal housing instability that may otherwise go unnoticed.
What it doesn’t capture
SFUSD data includes only students enrolled in the district. It does not include infants and preschool-aged children, unenrolled children, or students enrolled outside SFUSD. (Families with children under 5 make up the largest subset of the family homelessness population.) As a result, it offers an important perspective on student homelessness but should not be interpreted as a complete measure of family homelessness citywide.
Family homelessness reflects broader inequities in our community.
Families of color are disproportionately represented in San Francisco's homelessness response system. These disparities are not the result of individual choices , but of decades of structural inequities in housing, education, wages, employment, lending, and wealth-building that have left some communities at far greater risk of housing instability. Understanding these disparities is critical to creating solutions that are both effective and equitable.
Families enrolled in Coordinated Entry in 2025:
Sources: San Francisco Department of Homelessness and Supportive Housing, Coordinated Entry and Housing Demographics dashboard, filtered to families enrolled in Coordinated Entry during 2025; U.S. Census Bureau, QuickFacts: San Francisco, California.
